

PM + AI @ USC IYA

Somony
Pou.

Graduate student at USC Iovine and Young Academy. Former technical program manager in the U.S. Navy.

Somony Pou in a dark suit, standing in a columned courtyard

About

From idea to delivery.

I lead cross-functional projects from idea to delivery. As a Program Manager in Power Distribution, I led 60+ load center cleanings on 4,160-volt systems with zero safety incidents. At USC, I combine product strategy, machine learning, and design to build ideas that solve real problems.

  • Product Strategy
  • Market Sizing
  • Competitive Analysis
  • PRDs
  • Financial Modeling
  • Python
  • Machine Learning (scikit-learn)
  • Program Management
  • Figma

Featured project

Peel: What if mental health had a vital sign?

A stress-hormone sweat patch and app for people managing stress-response conditions. IDSN 599 semester project, team of 6.

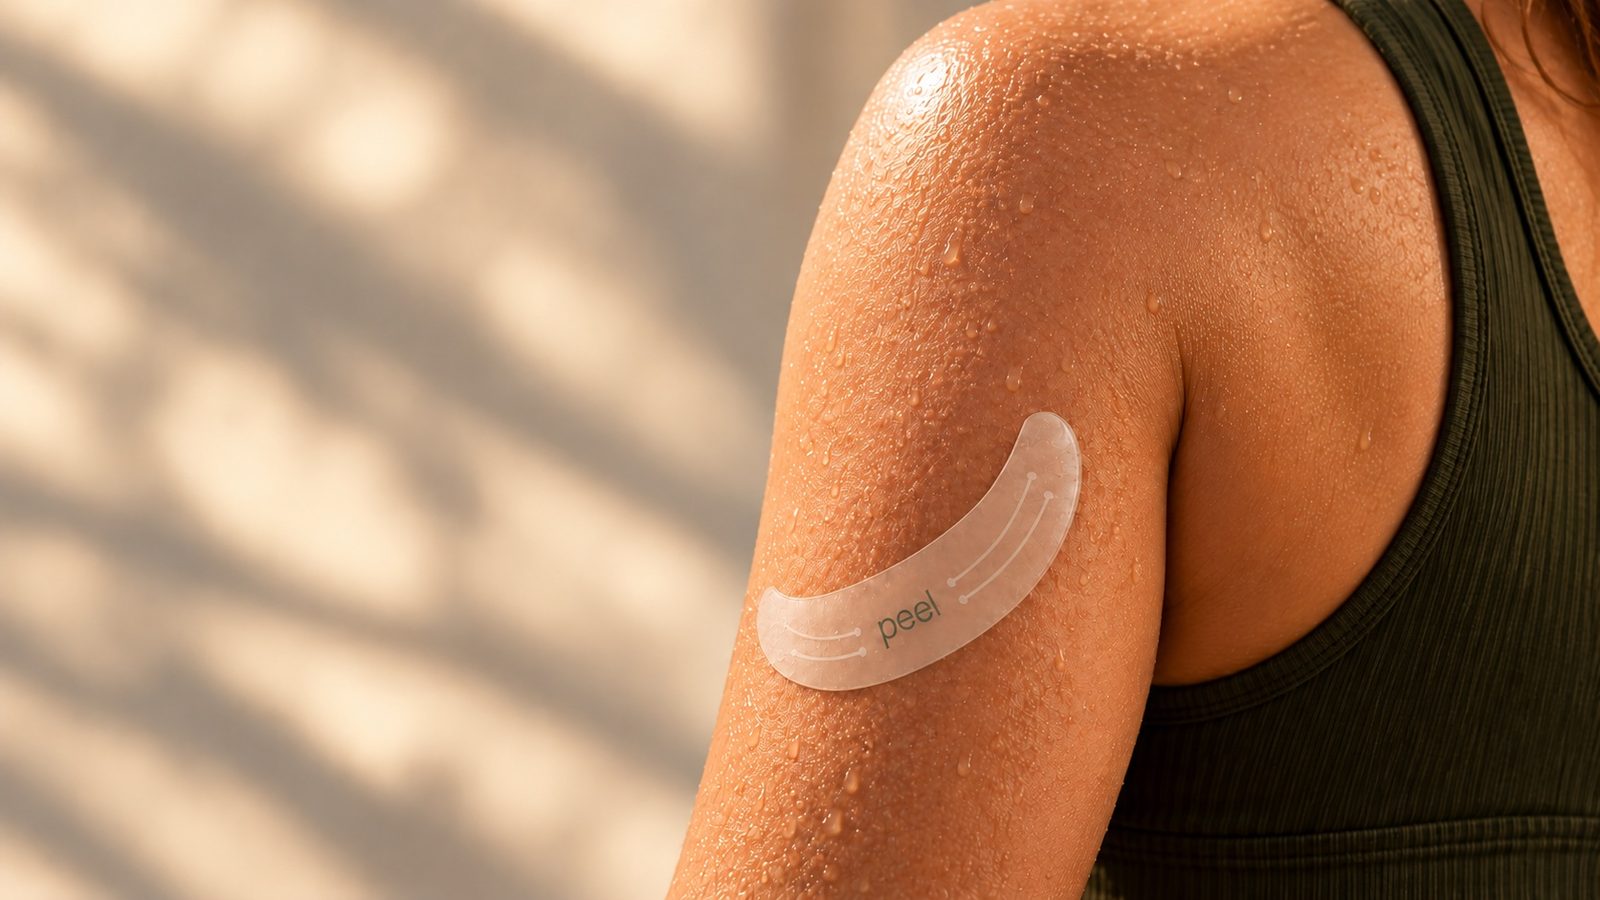
A clear Peel sweat patch worn on the upper arm

a · My role

I built Peel's financial case: the TAM/SAM/SOM market sizing, the use of funds for our $5.5M seed, and the pro forma.

b

The Problem

30%

of U.S. adults live with a stress-response condition

6+ yrs

the typical wait for a diagnosis

50–70%

report not being taken seriously by clinicians

Anxiety, BPD, depression, POTS, and PTSD overlap in symptoms, which makes diagnosis slow. Patients then trial 2–4 medications without knowing how each one affects their body.

87% feel burdened by the mental load of discovering their own triggers. Stress-response disorders lack actionable data.

c

The Solution

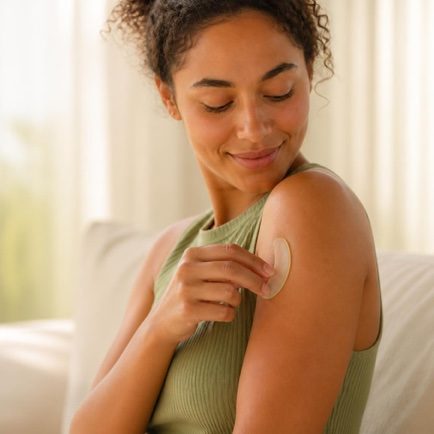
Woman applying a Peel patch to her upper arm

01

Wear

A near-invisible patch on the upper arm collects microscopic daily sweat. Tracks stress quietly, all day.

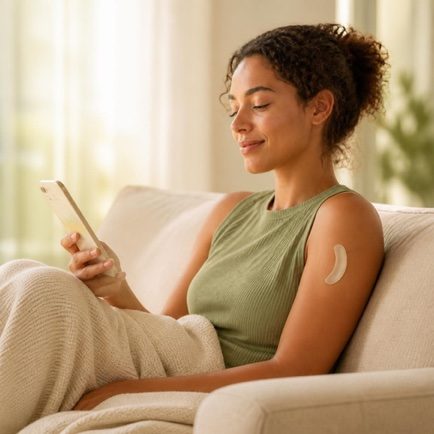
Woman on a couch checking the Peel app, patch on her arm

02

Reveal

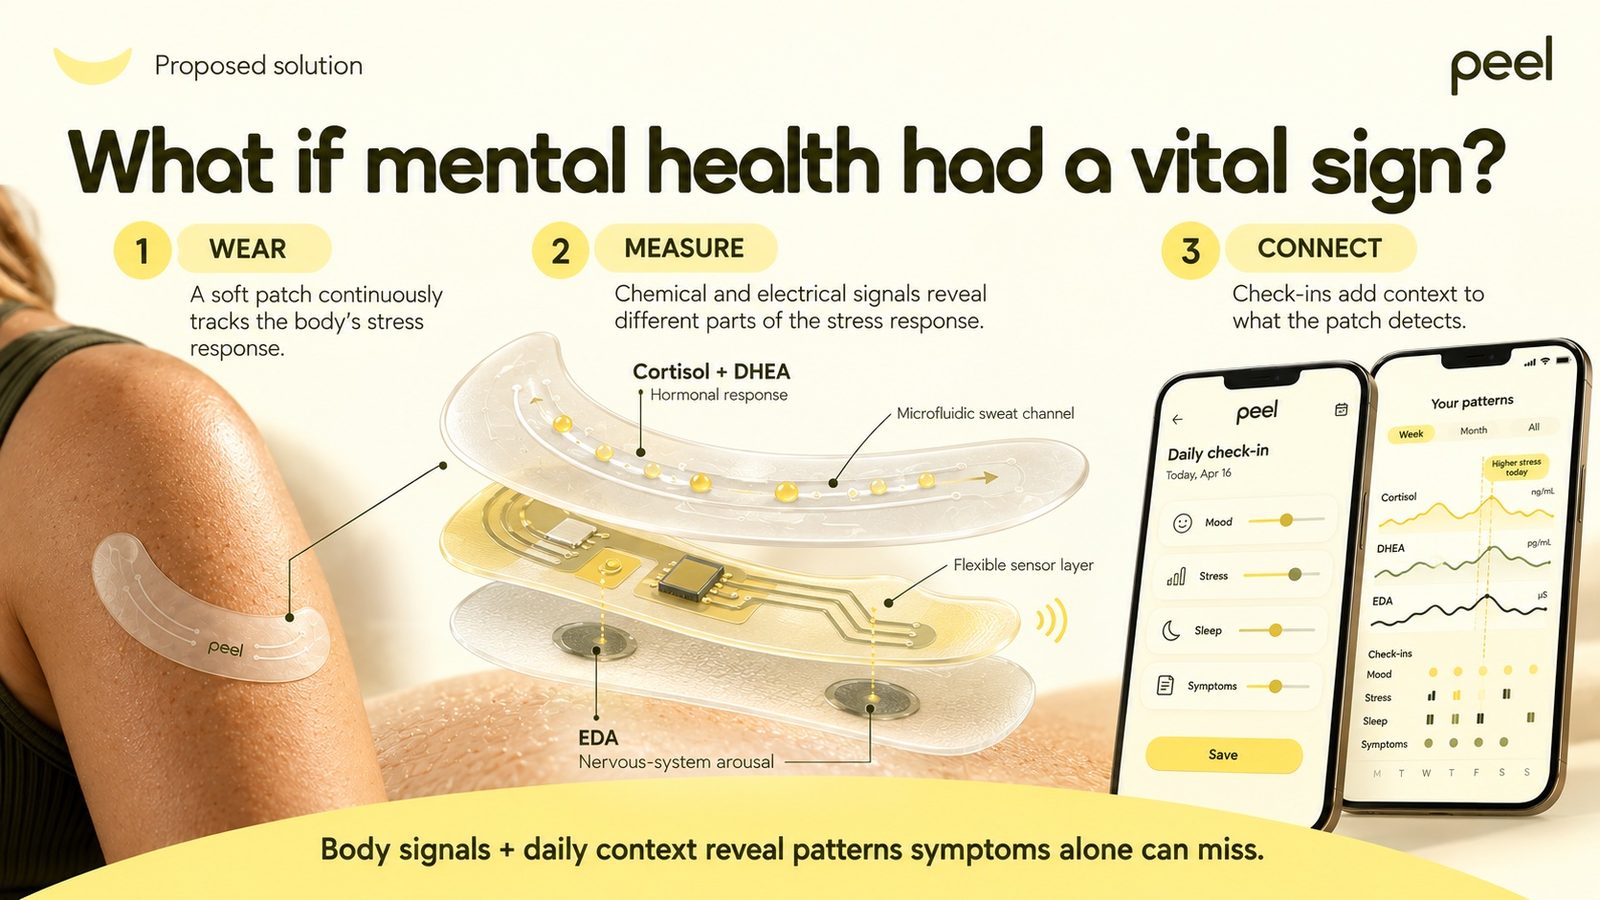
Cortisol, DHEA, and EDA show the body's stress response. App check-ins match feelings to body signals.

Woman smiling outdoors wearing a Peel patch

03

Thrive

Calmer days, better care — with concrete biofeedback to bring to clinicians.

Sold direct-to-consumer as a wellness device.

Peel patch layers — cortisol and DHEA sweat channel, flexible sensor, EDA — next to the daily check-in and patterns app screens
d

Market Opportunity

TAM $31B
SAM $10B
SOM $102M

TAM

61.5M Americans

$31B

SAM

15M already wearing health trackers

$10B

SOM

147K customers

$102M

29.5%

CAGR

+960%

Google searches for cortisol monitors

e

Competitive Landscape

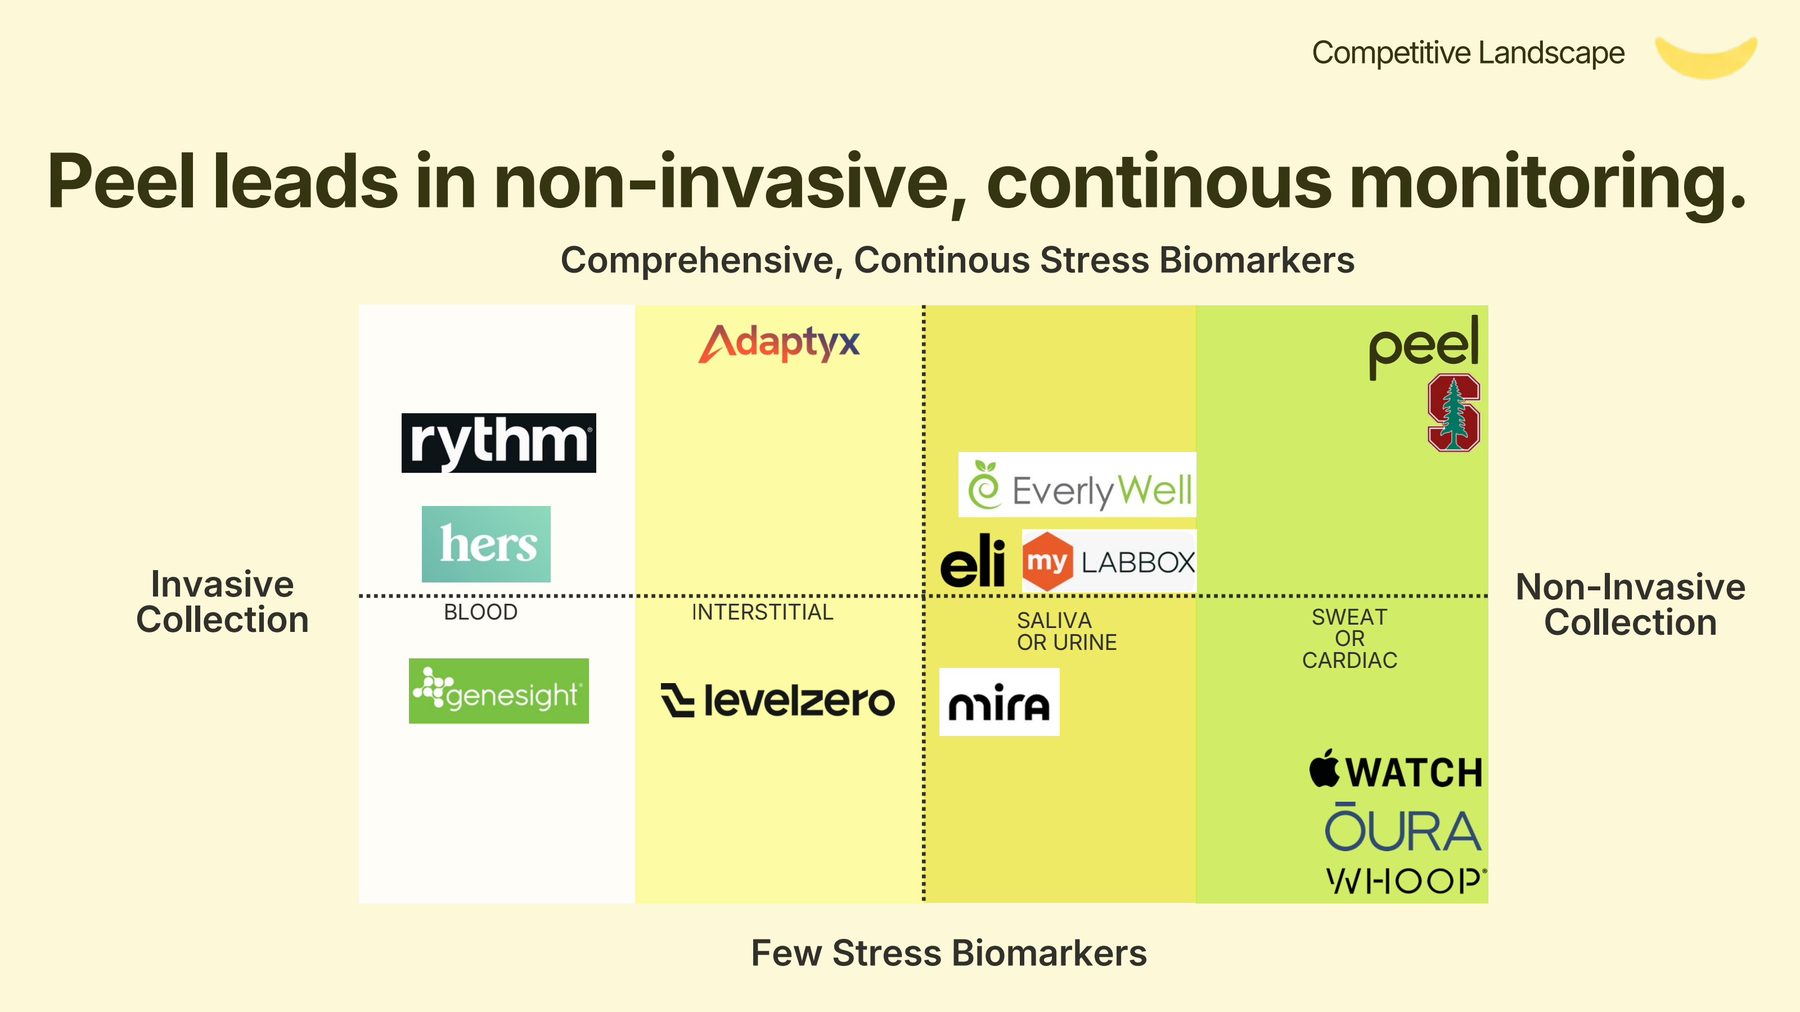
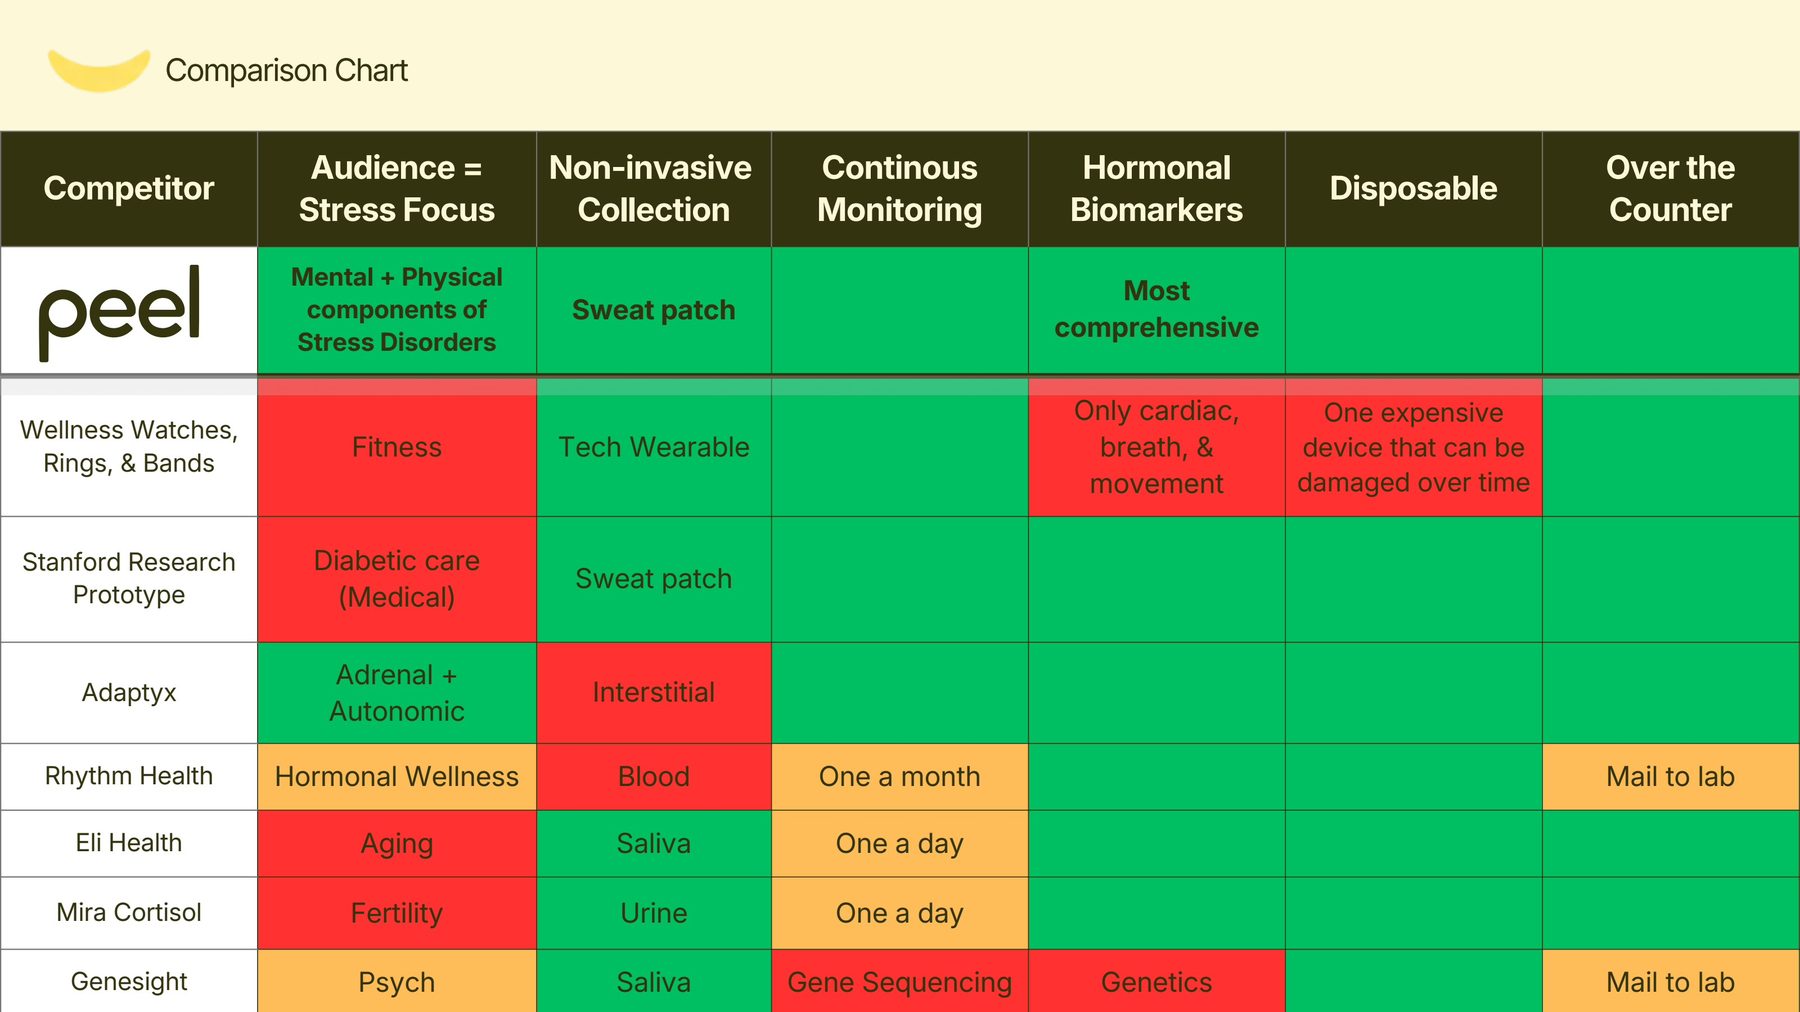
Peel is the only option that is non-invasive, continuous, and tracks hormonal stress biomarkers.

2x2 chart placing Peel in the non-invasive, comprehensive-biomarker corner, ahead of Rythm, Hers, Genesight, Adaptyx, Levelzero, Mira, Eli, Apple Watch, Oura and Whoop
Positioning: invasive vs. non-invasive collection, few vs. comprehensive stress biomarkers
Comparison table: Peel meets every criterion while wellness wearables, Stanford's prototype, Adaptyx, Rhythm Health, Eli Health, Mira and Genesight each fall short on some
Comparison chart across stress focus, collection, continuous monitoring, hormones, disposability, and over-the-counter access
f

SWOT

S

Strengths

  • Low barriers to access: direct purchase, home delivery, no prescription
  • Data flywheel: more usage improves the sensor
  • Proprietary algorithms keep an accuracy edge and aid retention

W

Weaknesses

  • Substantial validation and development cost
  • Non-medical tracking can't be used for diagnosis
  • Patch replacement raises cost; insurance doesn't apply (HSAs can)

O

Opportunities

  • New breakthroughs in stress biomarkers and sweat collection
  • 60M adults with a stress condition, climbing post-COVID
  • +960% Google searches for stress monitors
  • Rise of health wearables: more acceptance, cheaper sensors

T

Threats

  • Alternatives: cardiac wearables and at-home blood tests
  • Trust: a data leak or poor performance hurts reputation
  • Established brands (Oura, Abbott, Dexcom, Apple)
  • Wellness regulation could tighten
g

Business & Funds

Subscription

$69/month

Raising seed

$5.5M

Use of funds

  • Product & validation$1.43M
  • Team$1.26M
  • Manufacturing$0.97M
  • Go-to-market$0.87M
  • Reserve$0.50M
  • G&A & regulatory$0.48M

Milestones

  1. Q1 2027

    Finish sensor validation and closed beta

  2. Apr 2027

    Direct-to-consumer launch at $69/month

  3. Dec 2027

    ~2,400 paying subscribers, 41% gross margin

  4. 2028

    Series A to scale to 12K subscribers

Path to profit: EBITDA-positive in 2030 and $10.7M revenue by 2031, matching our SOM.

h

Team

  • Alexander Infante
  • Ada Li
  • Breeze Pickford
  • Somony Pou
  • Jason Stringer
  • Sihuixin Wang

More projects

Other things I've built.

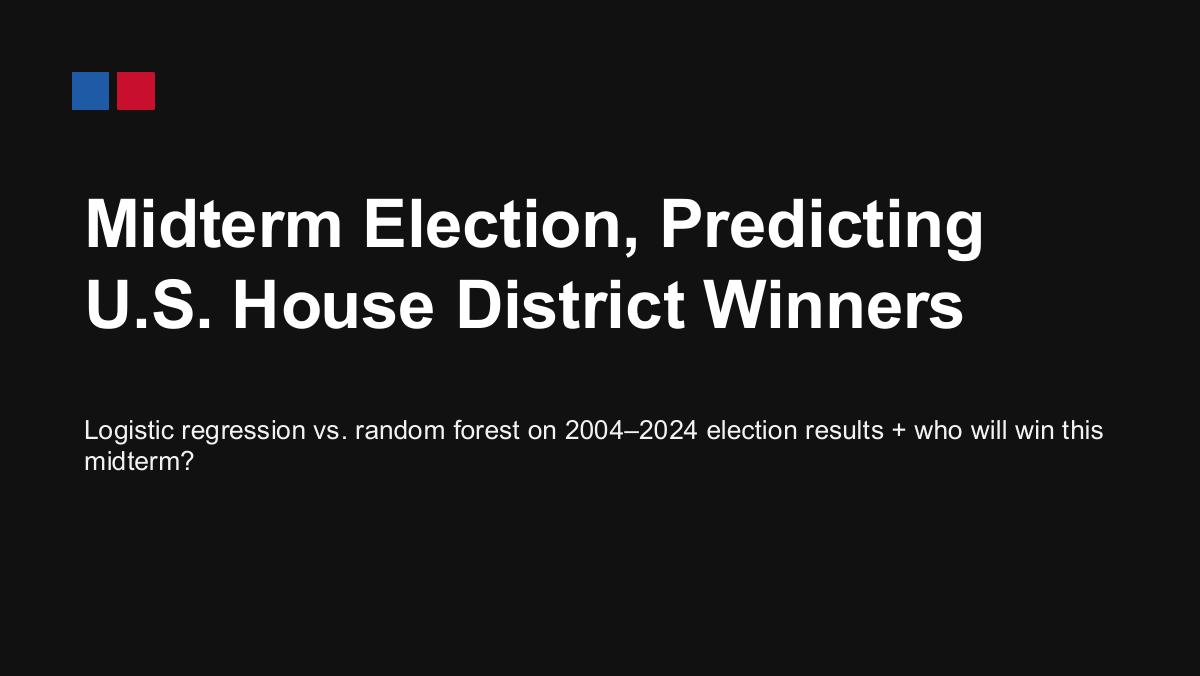
Cover of Somony's U.S. House district prediction presentation

Predicting the 2026 House Midterms with Machine Learning

Compared logistic regression and random forest on 3,660 district-elections (2004–2024). Logistic regression achieved 97.3% accuracy on the 2024 test; the 2026 forecast covers 262 districts and examines uncertainty in competitive races.

  • Python
  • scikit-learn
  • Data
View project (PDF)
Cover of Somony's fantasy basketball prediction presentation

Will I Win? Fantasy Basketball Win Probabilities

Built 12,000 simulated teams from four seasons of player statistics, then used logistic regression to estimate championship probabilities. My drafted roster had a 33.8% chance of finishing first—not a guaranteed win.

  • Machine Learning
  • Sports
View project (PDF)
Cover of Somony's Haberman survival presentation

Haberman’s Survival: Learning the Limits of a Perceptron

Explored breast cancer survival classification using 306 historical patient records. Iterated on scaling, shuffling, feature selection, and class balancing to understand model limitations and the risks of missing clinical context.

  • Python
  • Classification
  • Health Data
View project (PDF)

Economics research

Research papers.

ECON 474 · Group research · 2026

The Impact of Eviction Activity on Property Appreciation in California

Co-authored a study of California cities using 2004–2013 panel data and city and year fixed effects. Examined the negative association between eviction filings and property appreciation, while distinguishing correlation from causation.

Read paper (PDF)

ECON 318 · Group research · 2025

The Effect of the Annual U.S. Tariff Rate on U.S. Real GDP

Co-authored an analysis of U.S. economic data from 1960 onward using OLS and GLS regression. Compared tariff rates with real GDP growth while accounting for inflation and interest rates, and discussed the limits of policy conclusions.

Download paper (DOCX)

Contact

Open to product and program management opportunities.